These days, a large consumer goods company has almost the same strong data productivity as a medium sized Internet company. Management in more and more companies hopes to manage users and data in the same way as Internet companies, then make decisions based on data.
Nevertheless, colossal and dispersed data stands in the way of IT, management and analysis departments of companies that are yearning for nimble and real-time data analysis. Consulting firms, which were playing a huge role, have now lost the power to pile up data and provide insight. They don’t have enough hands for this.
We started working with a leading fashion consumer goods company in China to build its data platform. It took us only six months to put together the functions to gather and analyze data, consumer profiling, member systems and external data tracking and capturing. We would like to share relevant knowledge in these three fields in hopes of better streamlining operations powered by the force of data.
Read this article in Chinese
Big Data & Business Intelligence
The term “big data” comes with the implication of a concept or mentality, rather than to describe some tool or technology. It can be understood as a general sum-up of specific algorithms, technologies and tools, including data mining, machine learning, natural language processing and distributed computing. Business Intelligence, or BI, has a much longer history than big data in the corporate world. Tech giants like IBM, Oracle, Microsoft, Informatica, SAP, Sybase and Teradata led a trend of adopting BI software, with waves of smaller players following suit. BI is also a general term that comes with a wide coverage of tools and technologies, such as data warehouse (or data mart), inquiry statement, data analysis, data mining, data backup and restoration, to name just a few. What features distinguish the two?
Business Intelligence (BI)
For a large consumer goods company, at least 10 IT systems are needed to support daily operations, and they are listed as follow: 1) A distribution system that sorts out goods distribution to thousands of storefronts and processes as many as 100,000 orders. 2) An e-commerce order system that operates order management and customer service (for companies like JD.com, Vipshop, Yihaodian, Jumei, Amazon, Dangling and Youzan). 3)Warehouse management system that arranges logistics nationwide and records inventory for thousands of SKUs. 4) BI system: In charge of data collection of every major business segment, and brings up the daily statistics chart. 5) Other finance, HR, performance management, brand/branch order system with huge daily data size.
The most common use of enterprise BI software is to integrate all IT systems for statistics and records for a better understanding of daily company operations and data through front-end charts and numbers generated and calculated by the system. Except for its ETL portion, BI software is easily generalized, good for cross-industrial use, and suits universal needs.
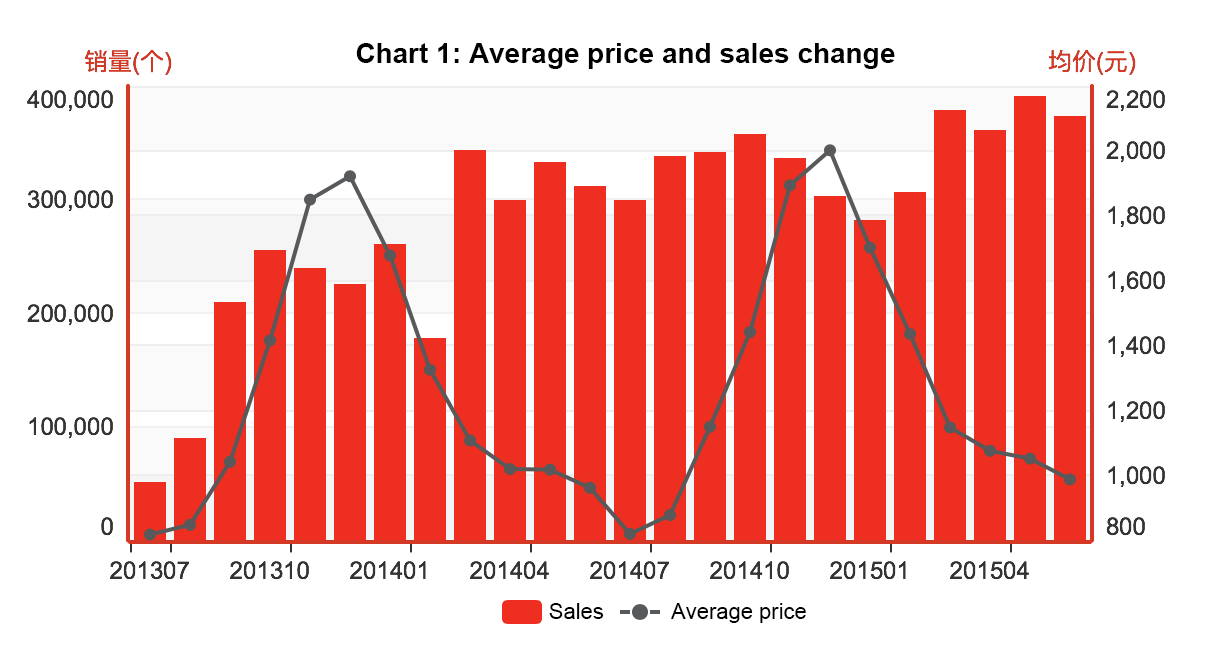
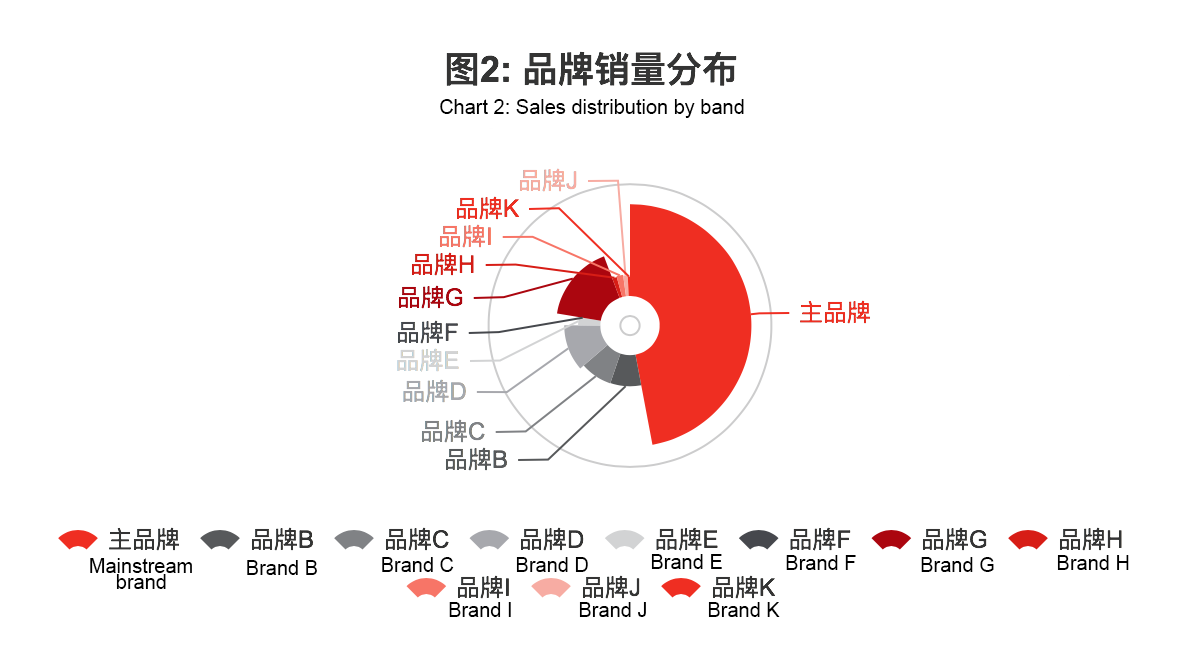
That is why the selling point of BI software is its function in monitoring data before coming up with reports and charts based on time, distribution, or segments. Chart 1 reflects the average price and sales change at this company over two years. It is easy to identify a general upward trend, with January and February being the slow months, while the end of each quarter picks up rather fast. Price barely changed over the past two years, being higher in the winter than in summer. Chart 2 is about sales distribution and the ratio of each brand owned by the company, which has a mainstream brand with a strong performance and a couple of sub-brands achieving impressive sales records, according to the graph. It is important for companies to pay close and regular attention to sales distribution charts so as to adjust resource allocation and company development strategies in a timely manner.
BI software is most helpful in collecting and garnering all business data to come up with visualized charts for long-term monitoring without further programming inputs. It can always stay updated in comparison to the static reports provided by traditional management consulting firms, which are basically useless after day 1.
Data Science
Data engineers always understand BI software as a data analysis tool, which is a foundation for developing insights into this data. Data scientists can provide insights, intervention and industrial input into these numbers and come up with reports more sophisticated than BI ones. Higher level reports can be applied to product design, marketing plans, membership schemes and after sales service, so that data can have the driving force to propel growth of business, just like in Internet companies.
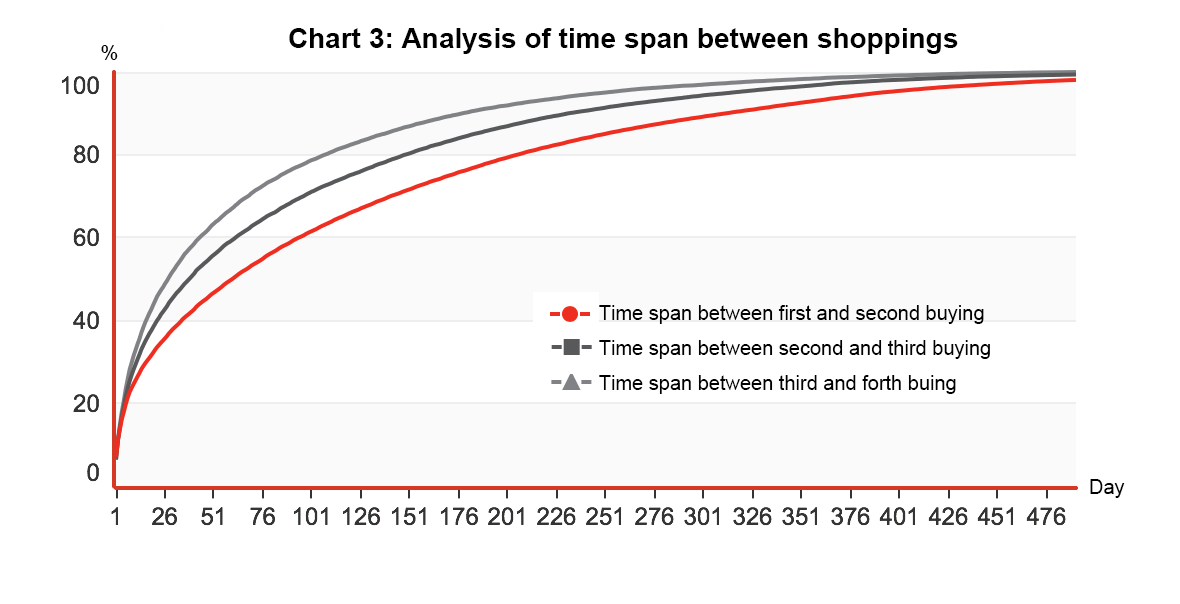
Chart 3 is a CDF curve (Cumulative Distribution Function) with X being days and Y being percentage. 37% of users will purchase the same thing again after they first bought it one month (30 days) ago. 45% of users chose to buy for a third time within one month after the second purchase. 51% of users had a fourth time purchase within one month after their last buy. The CDF curve shows a tendency to lean leftward with more and more purchases being made, showing that customers want to buy more frequently with established brand recognition. Hence, the best time to build brand awareness to attract new customers is the end of each quarter, namely each 3 to 4 months, while reconnecting with existing customers. 1-2 months as an interval is optimal. This is a typical case when data engineers have the power to look into industrial numbers with their knowledge and experience, which cannot be achieved by BI software. Re-purchase with intervals is a unique scenario in the sale of consumption goods. A more complicated and tailored statistical tool is required to dig into the data to find patterns and insights. Through statistics script-writing and multiple compounded SQL (Structured Query Language), data engineers proved the value of their manual work.
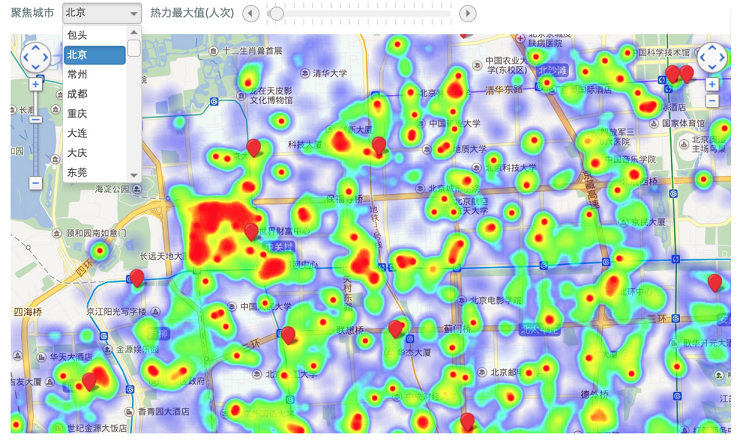
Other than complicated and highly customized statistics logistics, processing and exploring unstructured data is not an easy task for BI software. For large consumer goods companies, full e-commerce channel operation has become the new normal. Everyday companies like JD.com, Tmall, Vipshop, Yihaodian and Jumei have seen tens of thousands of orders swarming in, containing mammoth amounts of data including user location, identity, occupation, consumption power, etc. Companies can apply precise research on users via programming and map API (Application Programming Interface). Chart 4 is the heat map we drew based on shipping addresses of each order we received. It is easy to tell that a large proportion of users gathered around Zhongguan Village, followed by clusters of college dormitory buildings in Haidian District of Beijing. Red tabs on the map show the brick-and-mortar shops the brand owns, which have been covering Zhongguan Village, Peking University and Wudaokou area. The company has to rethink the Anzhenli store, where we don’t see much activity, and contemplate the possibilities of opening storefronts around Zhichun Road and Mudan Garden, where we see relatively busy traffic.
As valuable as the heat map is to companies, it’s not easily created by traditional consulting firms.
Even seemingly less important data that’s not necessarily covered by daily monitoring can provide great insights. Chart 5 shows the shopping time for people who place orders online. It is easily identifiable that almost every weekend, orders are distributed evenly across the entire day span, except for midnight. It gets more interesting when we are looking at the trend on workdays. The order number spiked from 9 to 10 in the morning, meaning a large group of office workers have to start the day with a purchase of their favorite items. So what’s the message to e-commerce companies? Send your marketing promotions from 8 to 10 each morning to grab attention.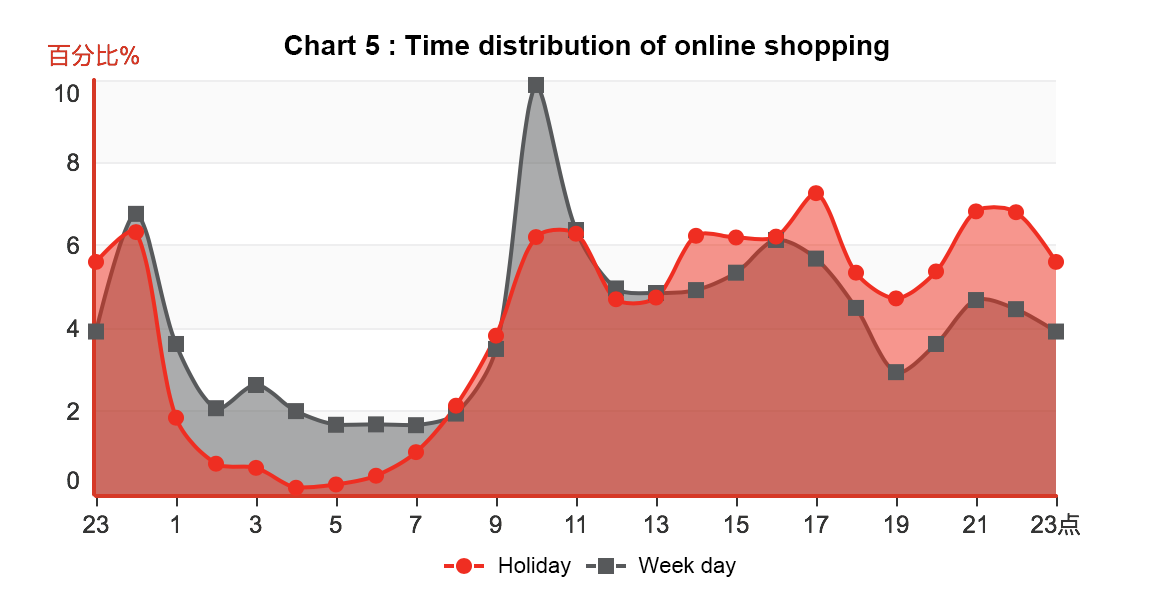
Almost the same line of thinking holds with Chart 6 below, which shows the purchasing pattern according to each day of the week. Monday and Tuesday are always the busiest, with the weekend appearing quiet. What we can create from this pattern of online shopping, which is a great cure for “Monday Syndrome,” is a channel for office workers to relieve their pressure. Accordingly, the passion for shopping ebbs when the weekend is approaching.
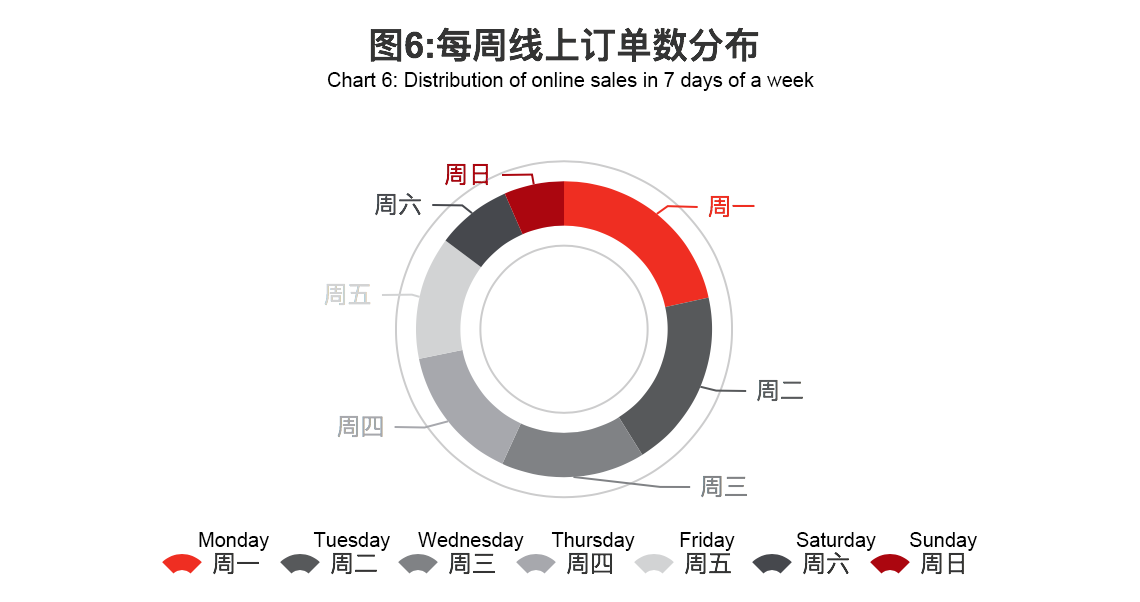
Data from Chart 5 and 6 are usually not detectable by BI software, but can be marked down and interpreted into insights with commercial value by data engineers. Consulting firms are not powerful enough to integrate a sea of numbers and process daily, or even hourly, output.
Data science (bid data) and BI with a macro sense do not differ significantly from each other. They both cover a wide range of services with the core being business progress through data processing and analysis. The BI we talked about amongst our general conversation refers to the BI software/set provided by software makers for business charts and statistical monitoring, which are separate from work related to data science. BI software provides an abstract and convenient summary of data, statistics and visualization tools to cover a part of the job of data science. If we are looking to plough through to achieve analysis and insights at multiple levels with industrial importance, it is indispensable for data engineers to join the task force to set up specific data systems to complete the work.
(To be continued.)


